Integrating BlueCoat Proxy SG Access Logs into Splunk

Recently, I had to integrate access logs from BlueCoat’s SG series webproxy into Splunk. The basic approach is quite simple, create a new Log in the SG’s Admin GUI, assign a log format to it and select “Custom Client” as upload client. On Splunk side, create a TCP input and route the data to the index of your choice:

/opt/splunk/etc/apps/bluecoat-sg/default/inputs.conf:


[tcp://1514]
index = bluecoat-sg
sourcetype = bluecoat-sg-accesslog

If you don’t use continous upload, you might want as well strip away the header that comes with the logs.
/opt/splunk/etc/apps/bluecoat-sg/default/props.conf:


[source::tcp:1514]
SEDCMD-bc1 = s/(?mis)^\#Software:.*$//g
SEDCMD-bc2 = s/(?mis)^\#Version:.*$//g

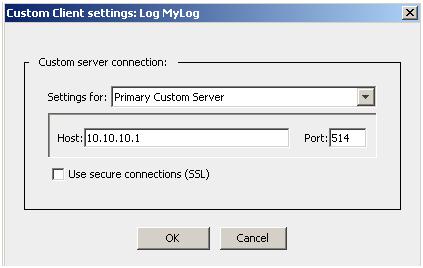
Ok, so far so good. BlueCoat also offers the possibility, to transfer the logs secured with SSL.

Here’s where the problem starts: Unfortunately, BlueCoats SGOS has a bug that doesn’t let you enter a hostname as “Custom Client” target, instead it only accepts IP addresses. Now, if your Splunk system has a TCP-SSL input and the certificate it uses doesn’t have an alternative DN set to the IP address of itself, SSL logtransfer won’t work for you. BlueCoat requires the DN of the certificate to match the value entered in the “Host” field of the “Custom Client”, otherwise it doesn’t send the logs. The only workaround until now is to re-issue the certificate with an alternative DN set to the Splunk systems IP address:


X509v3 Subject Alternative Name:
DNS:mysplunkidx.intern.local, DNS:10.0.0.110

Strangely, BlueCoat’s support didn’t know of that issue yet, so we filed a bug for this.

Links:
https://kb.bluecoat.com/index?page=content&id=KB4294&actp=RSS

Fixing US Date Format Bug in the Splunk App for Citrix XenApp

Recently, I was integrating some Citrix XenApp servers into Splunk and decided, to give the Splunk App for Citrix XenApp a try. Integration went fine so far (might need some fiddling with appropriate permissions in XenApp to allow local PowerShell scripts to query XenApp metrics) and soon the indexes were populated with data and the dashboards became usable.

After a while, some data was still missing and I started to investigate. It turned out, that the scripted inputs that run as PowerShell scripts on the XenApp hosts return their timestamps in a format, Splunk interprets wrongly (might be, that the European locale on the Splunk indexers caused the misinterpretation):


10.9.2012 11:05:44 GMT

was interpreted as 10th of September 2012, while it actually was the 9th of October. Of course, this limited (or ruined) the usability of the dashboards :)

Fortunately, this issue can be adressed easily by overriding Splunks automatic timestamp recognition.
Create the file /opt/splunk/etc/apps/SplunkAppForXenApp/local/props.conf on your indexer and add the following lines:


[WMI:ProcessDetails]
TIME_FORMAT = %m.%d.%Y %H:%M:%S
TZ = GMT

[WMI:InstalledSoftware]
TIME_FORMAT = %m.%d.%Y %H:%M:%S
TZ = GMT

[(::){0}xenapp*]
TIME_FORMAT = %m.%d.%Y %H:%M:%S
TZ = GMT

Et voila, from now on the events get timestamped correctly and the dashboards are usable.

For completeness, here is an example of the output generated by the local PowerShell Scripts:


10.9.2012 11:05:44 GMT - AccessSessionGuid="" AccountName="xxx"
ApplicationState="Active" BrowserName="Notepad" ClientAddress="xxx"
ClientBuffers="0 x 0" ClientBuildNumber="6" ClientCacheDisk="0"
ClientCacheLow="3145728" ClientCacheMinBitmapSize="0"
ClientCacheSize="0" ClientCacheTiny="32768" ClientCacheXms="0"
ClientDirectory="C:\PROGRA~1\Citrix\ICACLI~1\" ClientId="3801583231"
ClientIPV4="xxx" ClientName="xxx" ClientProductId="1" ClientType="WI"
ClientVersion="12.0.3.6" ColorDepth="Colors32Bit"
ConnectTime="10/09/2012 13:04:46" CurrentTime="10/09/2012 13:05:44"
DirectXEnabled="True" DisconnectTime="" EncryptionLevel="Bits128"
FlashEnabled="True" HorizontalResolution="1024"
LastInputTime="10/09/2012 13:05:13" LogOnTime="10/09/2012 13:04:58"
MachineName="xxx" Protocol="Ica" ServerBuffers="0 x 0" ServerName="xxx"
SessionId="2" SessionName="ICA-TCP#0" SmartAccessFilters=""
State="Active" UsbEnabled="False" VerticalResolution="2560" VirtualIP=""
WmpEnabled="True" UserName="xxx" FarmName="xxx"
SessionUID="129950318982301678:2:xxx" ScriptRunTime="129950319443893718"

Links
http://splunk-base.splunk.com/apps/48390/splunk-app-for-citrix-xenapp
http://docs.splunk.com/Documentation/Splunk/latest/admin/Propsconf